I regularly meet senior financial executives to discuss their business. I’m often impressed by the quality of analysis that has been performed on the numbers. No variance is too small to break down and subdivide into smaller numbers. Graphs are often added to display various tables. Their team’s knowledge of Excel seems second to none and they clearly see the monthly reporting pack as an opportunity to showcase that knowledge.
However as a leader of a company, what I really want are stories not numbers. Of course I want my business results to be quantified both financial and non financial. However I need insight into why something happened. I need to be able to use the data to formulate a set of tactcs that will produce success.
As a simple example let’s take the headline number of a $15m software business.
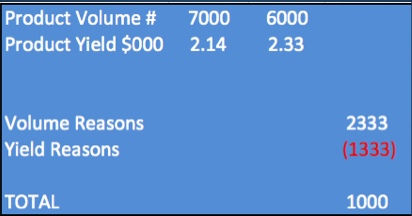
I can clearly see that we produced $1m more sales that budgeted. But what I want to understand is the story behind the numbers.
In this case the story, in summary, is that we closed 7000 deals at an average price of $2140 compared with the planned story of 6000 deals at $2330. As a leader, I need to know that. I need to know the volume and yields behind my team’s performance.
Of course this analysis can be taken down into the detail, by product, by quarter, by sales team, by region. But before I hear anymore or see anymore detail, I know that we sold more at a cheaper price creating a $1m surplus. The stories behind the average deal value being lower can now be explained. It could be discounting, delays in launching a new expensive product, delays in price inceases, etc.
Stories explaining the “why” are key to revealing the “what” to do next and by whom.
Like how we think – you’ll love our next workshop on Thursday. Sign up here.


